What gets measured gets improved.
Most leaders turn to Key Performance Indicators (or KPIs) to keep a pulse on how their business is running. While you may know “what” you want to measure, you don’t always have the right data at the right time to make an informed decision on how to improve your KPIs.
And, the problem usually isn’t that you don’t have enough data. The real challenge is collecting and organizing all your data in real-time so you can act on it when needed.
To better measure their KPIs, leaders are ditching their manual spreadsheets for real-time dashboards with one-click reporting.
How Paper Tracking and Spreadsheets Fall Short for Modern Businesses
Many firms already track their KPIs on paper or spreadsheets. What’s so great about a dashboard of similar data?
It comes down to efficiency, accuracy, and visibility.
How much time do you spend finding, uploading, and cleaning data from multiple sources into one spreadsheet? Do you trust the accuracy of your data when making decisions?
Most leaders can’t fully rely on manual processes and spreadsheets to make timely and informed decisions about improving their KPIs. If you’re only auditing data every month (or longer), you’re missing out on key insights that happen daily.
And, this problem isn’t going away. As our software applications continue to move to the cloud, firms of all sizes are using more systems than ever to run their business.
Companies with fewer than 1,000 employees run an average of 22 custom applications.
That means the data used to keep a pulse on your performance has to be checked and curated from many different places — which can be difficult and time-consuming to collect and standardize. Manual data tracking and spreadsheets just can’t keep up with the speed of NOW.
Read stories about powerful dashboards launched with SPARK →
The Right Data When You Need It in Real-time Dashboards
No matter the size of your business, dashboards can provide a centralized view of your KPIs in real-time. Through automation and logic, you can aggregate your data from various systems into a visual story that clearly shows how your teams are doing.
The best part? Dashboards are “always on” — collecting, organizing, and presenting insights into how your business is operating at any moment. You won’t be making decisions based on stagnant or missing information. You can trust that you’re making an informed decision to improve your KPIs with accurate data.
Real-time dashboards can be a game changer for your business. Decision makers can spot both positive trends or ones that pose a risk. Any needed changes to your processed can be quickly pinpointed and deployed.
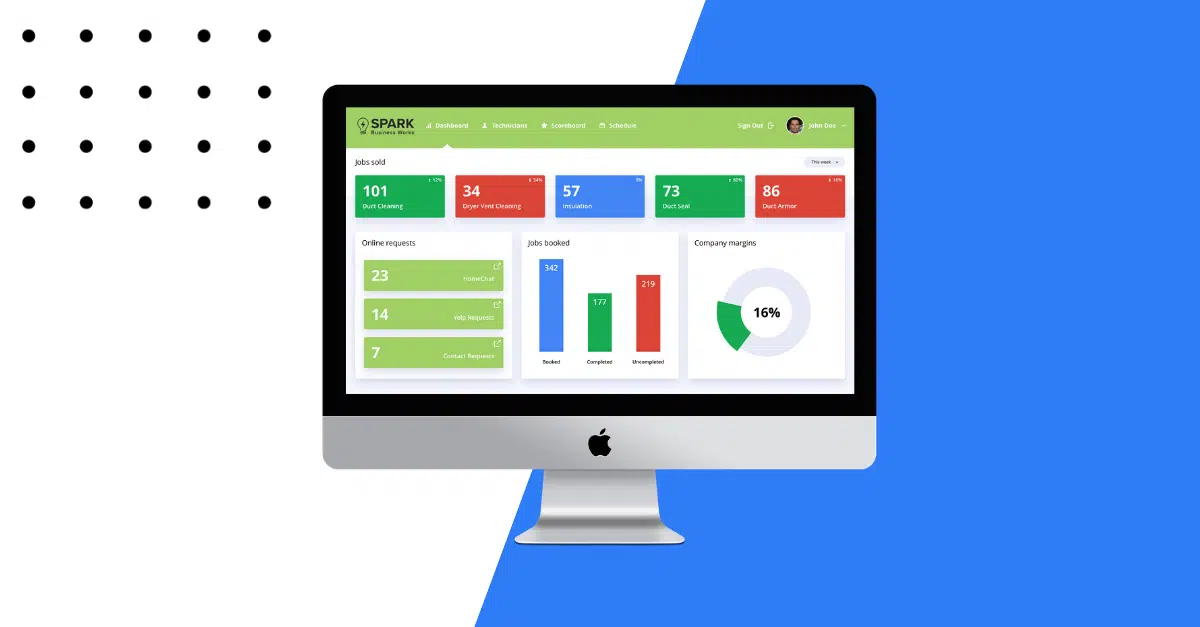
.png "How the Right Dashboard Can Help Improve Your KPIs 1")
What Makes a Dashboard a Game-Changer for Your Business
While dashboards are common today, not all dashboards are created equal. Without some guidance, you can still end up with a dashboard that looks nice, but doesn’t actually help you improve your KPIs.
When creating a new dashboard, be sure to focus on:
1. The RIGHT KPIs
For many leaders, one of the most challenging tasks is finding 5 to 15 indicators that provide the right pulse of your business. While you can measure just about anything, it doesn’t mean that it all needs to be on your dashboard and shared across the organization.
Using a business leadership methodology like EOS, we recommend taking these steps to identify your key indicators for your organization. You might find that you have one set of key indicators the business as a whole needs, while a single department contributes (and should be measured) at a more granular level.
Defining a set of key measurables and sticking to them also helps you measure progress over the long-run. You won’t get distracted by numbers that don’t help you move the needle.
2. Telling a Simple Visual Story
One of the biggest advantages of a dashboard is that it tells a visual story of your performance, making your data easier to digest and share. By minimizing how much data you present to your team, they’re more likely to remember and apply it throughout their week.
As you create your own dashboard, think about how you want to communicate your vision and plan across the entire organization. It can show others where you’re heading and how you’ll get there. And, in the long run, making your KPI’s “sticky” also helps you get buy-in from the team for tracking the right data and why.
3. Make it Easy to Share
People across your organization should know how they’re performing in real-time. If they aren’t working toward a clear target, they can become frustrated, confused, or unmotivated.
You can use your dashboard as a tool to communicate with employees about their target numbers and their current performance against them. This helps the entire organization understand where they stand at any given moment.
Consider some simple formats to share the dashboard. A PDF by email? A push notification to their phone? Carefully designing HOW people will access and interact with the dashboard is just as important as the technical infrastructure for collecting the data.
3. Customization is Key
While you may have access to out-of-the-box reporting from your current systems, these don’t usually tell a FULL story of your data across all your systems by themselves. They often miss how your individual systems, processes and people interconnect and work cohesively to power your business forward.
Powerful dashboards are customized to show a comprehensive view of your business and how each part impacts the whole. And, when you can view this data in real-time, you’ll be able to make an informed decision when you need to.
4. Communicate Clearly with RELEVANT Alerts and Notifications
A great dashboard also provides alerts and notifications. You should be able to customize these alerts to your preferences so you’re only notified of an issue when it’s worth your attention.
Build a Custom Dashboard with SPARK
At SPARK, we know a thing or two about dashboards because we build them every day for our clients. Even if you’re not sure how to begin ditching your spreadsheets, our team is ready to help transform your data into powerful dashboards. Contact us today!


