Does this sound like you on a construction job?
I wish I could see what’s happening out in the field, while I’m in the office.
I wish I didn’t have to track down that person for payroll.
I wish I had that incident report sooner.
I wish I understood our win-loss ratio for estimates, faster.
I wish I knew when that PO was submitted.
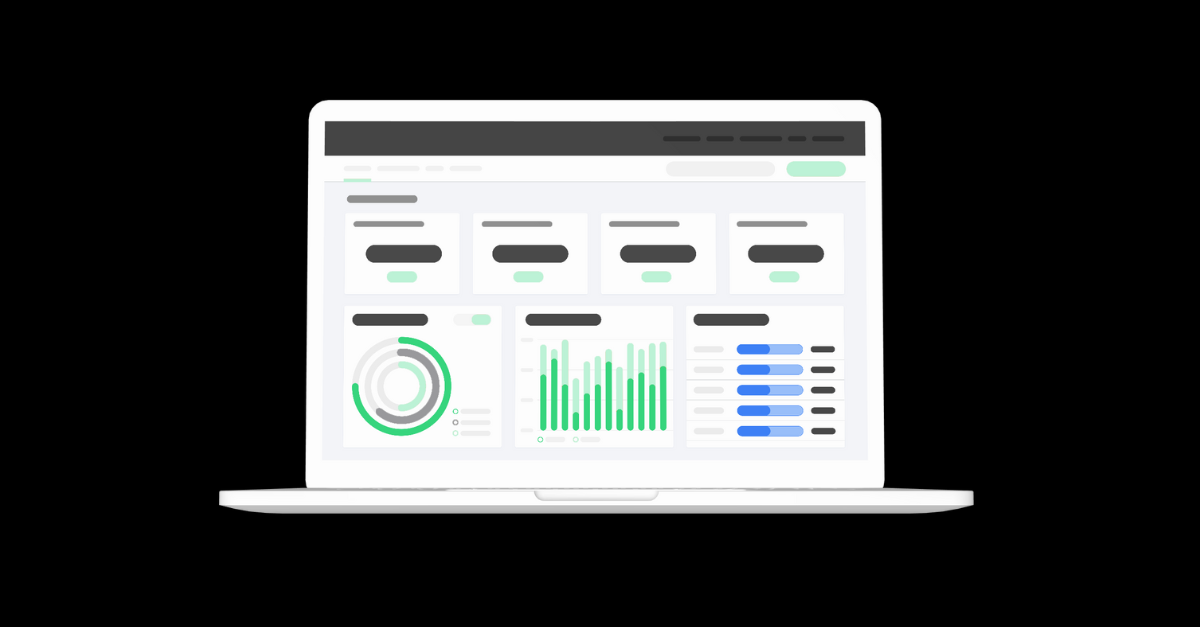
If any of these statements resonate, then it sounds like you need new custom reporting and dashboards for your operations. You need critical and actionable information at your fingertips, when you need it. You’ll never lose sight of daily performance. And stop wasting hours of your time trying to comb together data to make decisions.
Keep reading below to see how reporting can make your make your job (and life) easier.
 Why Construction Managers Need Reporting
Managers (or superintendents) have to do a lot. You have to monitor the progress of multiple projects, often from a distance. And you usually have incomplete information, whether it’s late or just plain wrong.
It’s easy to get swamped in a sea of data that is difficult to make sense of or use. It’s hard to make the right decisions.
Maybe you started digitizing data already, and it helps somewhat. At the very least, it improves the movement of info and its accuracy. That’s a huge advantage!
But digitization alone doesn’t provide the insights into your crews and projects like you need. Instead, you need that digital data to flow into real-time custom reporting and dashboards that you can view anywhere, anytime. See why.

How Custom Reporting and Dashboards Work
You’re probably familiar with business dashboards, whether you use them current or not. They summarize key data points or key performance indicators (KPIs) in a centralized location. They make your complex info easy to understand, so leadership knows how a business is doing at any given point in time. And they can take action, whether they’re responding to a negative or positive trend.
There are all different types of dashboards. But we’re talking about digital ones that automatically aggregate data from several sources and display it in real time. It’s made up of visual elements like graphs, charts, and tables.
When you put some thought into what you want your dashboard to show, they can become a critical tool in helping you keep a pulse on the daily performance of your operations.
What do they replace? Paper, spreadsheets, emails, and especially word of mouth. These types of dashboards are “always on” collecting and organizing data. You don’t need to wait for that 20-page plus stack of reporting to land on your desk to make decisions.
Read more about how the right dashboard can help improve your KPI’s.
Types of Construction Custom Reporting and Dashboards
Fortunately, you can use custom reporting and dashboards for all different parts of a construction business. See below.
1. CRM: Track Your Sales Activity
CRMs (Customer Relationship Management) keep sales teams aligned and informed of sales activity (emails, phone calls, etc). With CRM reports, you can track leads, closed deals, project status, and communication logs in one place. The example below shows progress of deals through the different stages of your sales funnel.

2. Estimating: See Your Win/Loss Ratio
Software can help estimators submit more accurate bids and show an overview of your estimating activity. What is the value of the bids you’re submitting? What is your win/loss ratio? How many opportunities is your team currently working on? See all that info in just a glance.

3. Job Progress/Daily Report: See What’s Happening Onsite
Most job sites still rely on paper forms to report critical field data on a daily basis. The problem? Managers don’t get the information until days later (because it sits on a truck somewhere). And when they do get it, they have to hope that it’s right or follow up in person.
Instead, team members can submit daily reports digitally. This gives you real-time awareness of what’s happening on any job site. You capture any field data, including photos, and it all rolls up into a dashboard to track progress. By automating this type of workflow, managers can typically save hours a week of manual data entry.
Read more about how to improve efficiency with digital field data collection.
4. Employee Time Tracking: Connect your Field Crews with Your Back Office
Time tracking and management is an important function for any construction company. How else do you know where your team members are and what they’re doing? It helps you deliver projects on time and under budget.
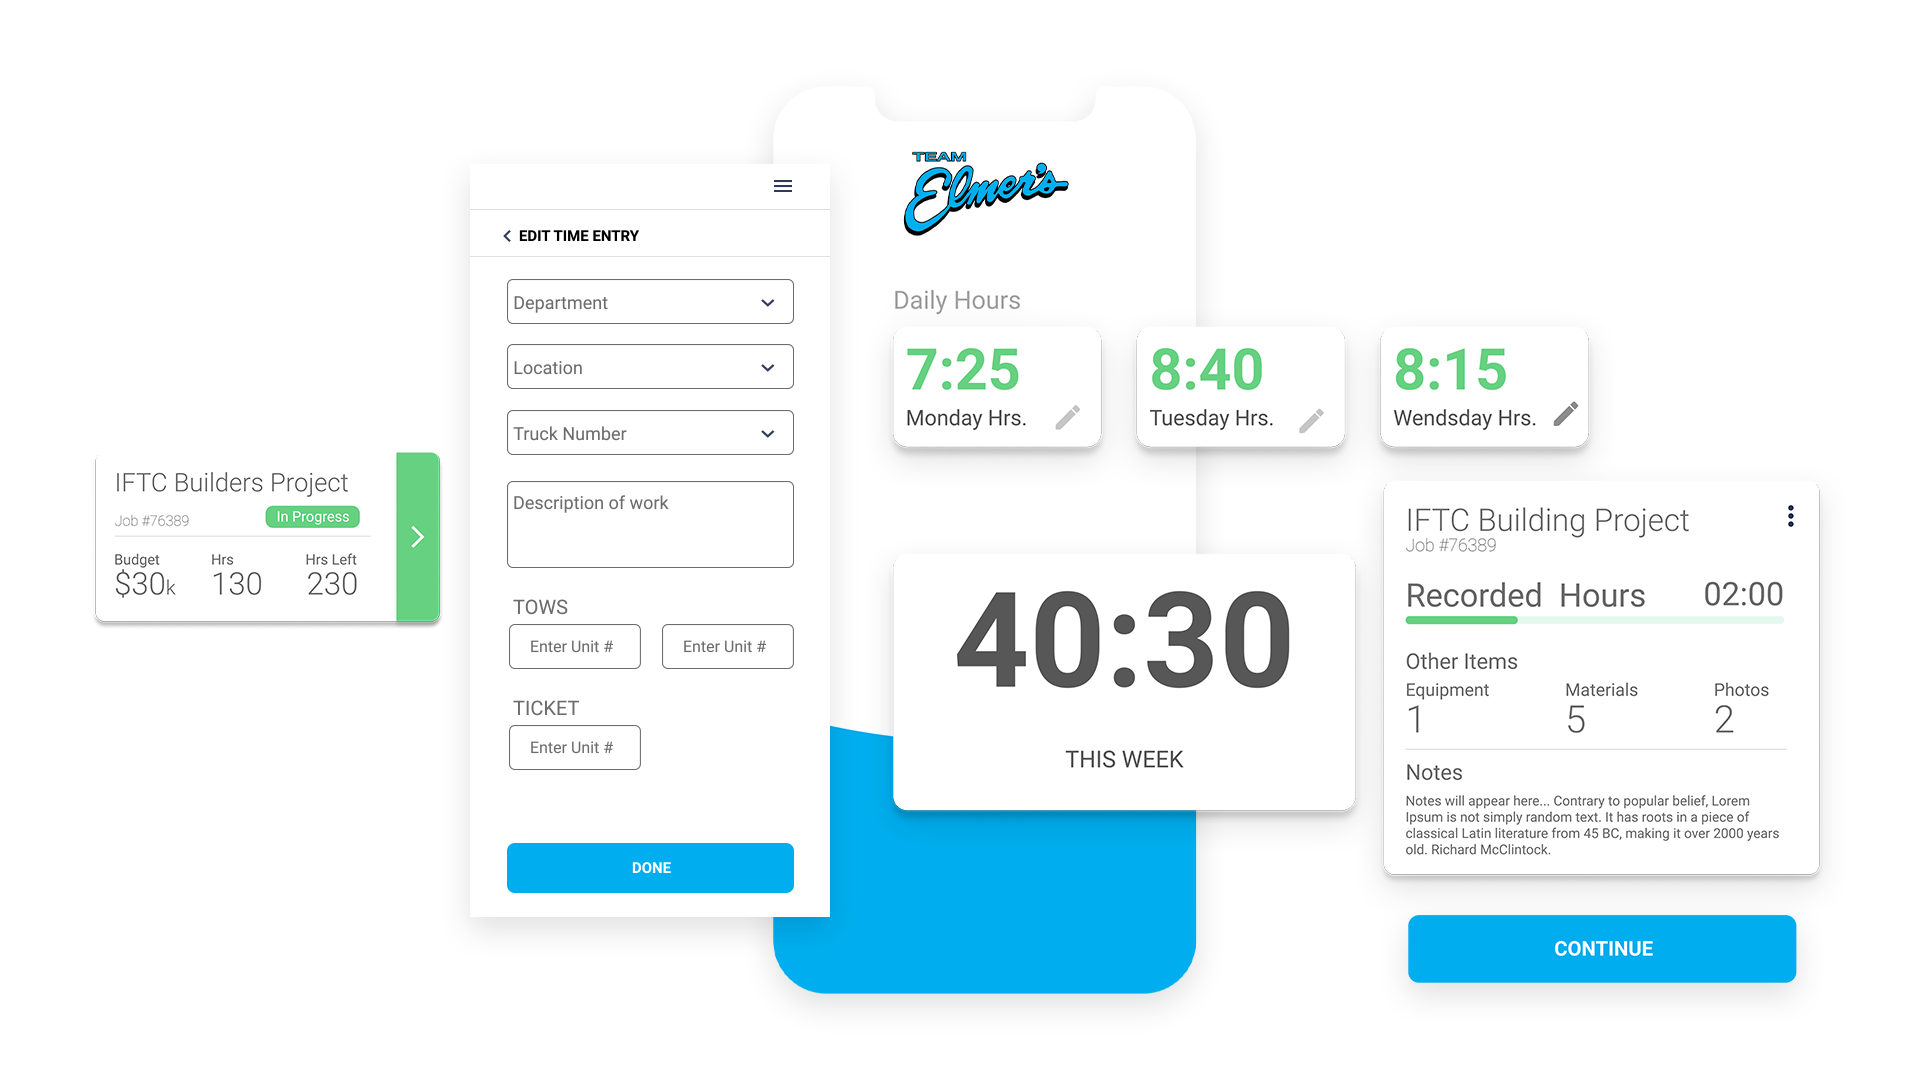
Moving time entry from papers to digital (like mobile apps) enables you to connect your back office with your field crews. You can run automated reports and see who is working how much time on what job. And you’ll trust that the data is accurate versus workers trying to enter time on its due date for last week’s work.
Read more about how Team Elmer’s uses daily time entry as one part of their custom mobile app by SPARK.
5. Purchase Order Management: Automate PO Process
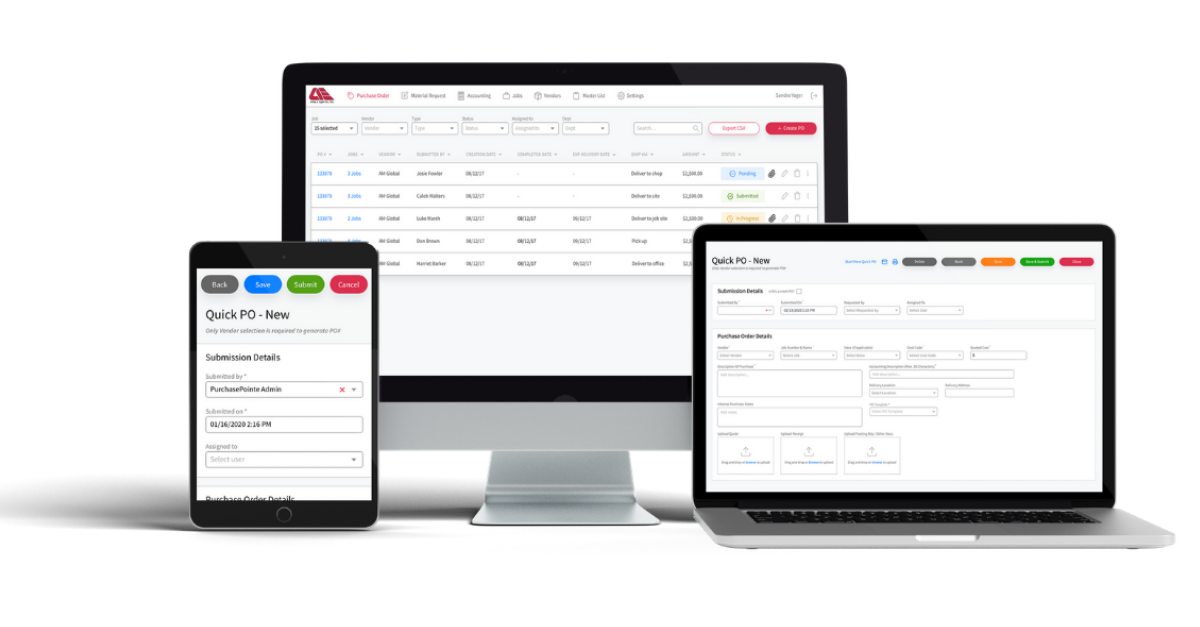
Vendor and PO management can be a time-consuming and frustrating task with papers constantly shuffled around the company. But turning your purchase order management into a digital workflow allows you to easily submit reports and notify stakeholders when updates happen throughout a job.
See how Andy J. Egan streamlined their process with a custom PO system, allowing them to process 1,000 POs efficiently in their first month of using it.
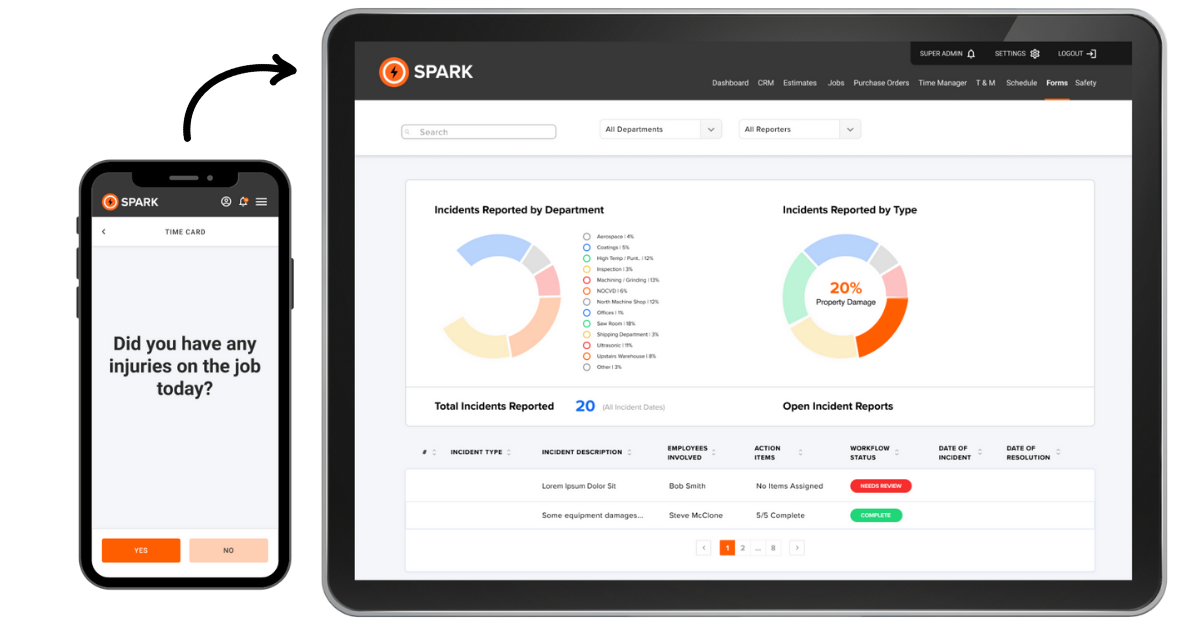
6. Safety: Automated Tracking and Alerts of Incidents
Safety managers are challenged to track and investigate incidents at dispersed job sites. They also must provide critical safety training and verify that employees have taken the training. Digital reporting helps you track incident reports, while also delivering and checking safety training.
Read more about using the right safety technology tools to protect your job sites.
Getting Your Own Custom Reporting and Dashboards
While these examples might be great, how do you actually build and get the right reports?
In some cases, you might have already tried (and been underwhelmed) from the reports that come from your off-the-shelf software. They didn’t quite fit your workflows or give you the data you need.
Fortunately, there’s a better way! You can build custom reporting and dashboards using the data and systems you already have.
With deep experience in the construction industry, we at SPARK know that your business has a lot of different variables to consider. We can help build the right custom reports that visualize your data the exact way you want, whether it’s for safety, POs, or daily field data.
When you’re ready, reach out to SPARK and see how we can help you level up.
 >
>

 Why Construction Managers Need Reporting

